Follow below steps for attaching java debugger when you are using native installation of Weblogic with OUAF
Navigate to your managed server for your OUAF product
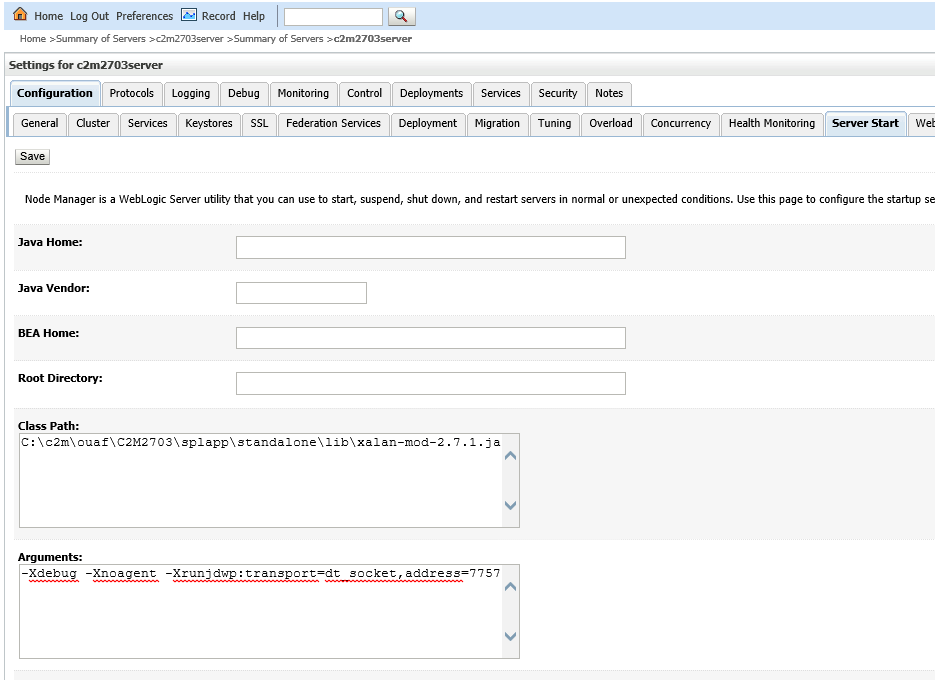
Server -> Your managed server -> Configuration -> Server Start

Add the following line in Arguments section
-Xdebug -Xnoagent -Xrunjdwp:transport=dt_socket,address=7757,server=y,suspend=n
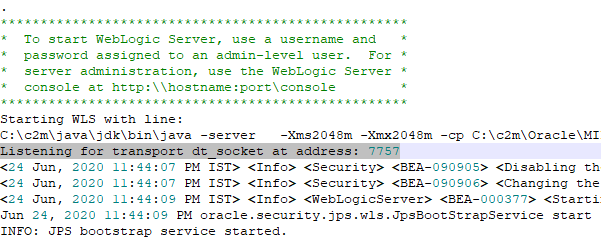
The highlighted number is the port on which you want to debug. Set it to a unused port. This is the port that you would be pointing to in Eclipse.
Alternatively you can also use setUserOverrides.cmd that is present in %SPLEBASE%\tools\examples\bin folder
Copy this file to your Weblogic Domain Home Location
%Weblogic Domain%\bin

Once changes have been done on weblogic server, restart the server.
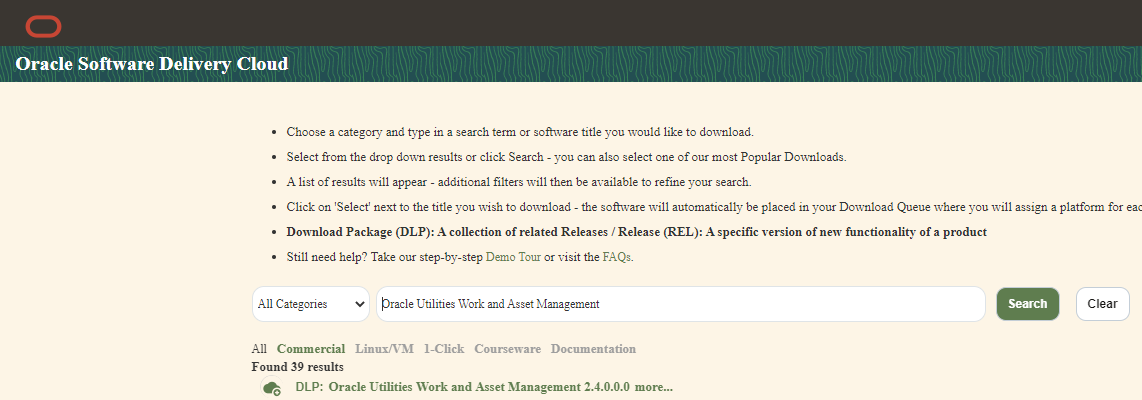
Assuming you have already installed Oracle Utilities SDK and pointed it to your OUAF application. Go to your SDK eclipse installation.
Go to Run -> Debug Configurations

Select Remote Java Application

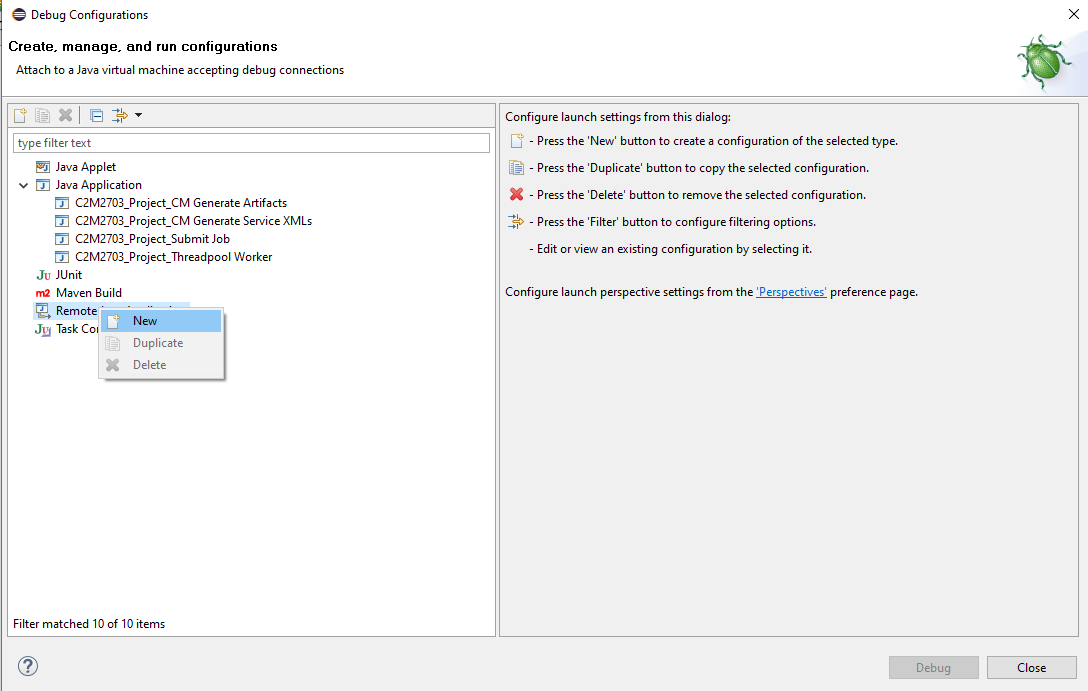
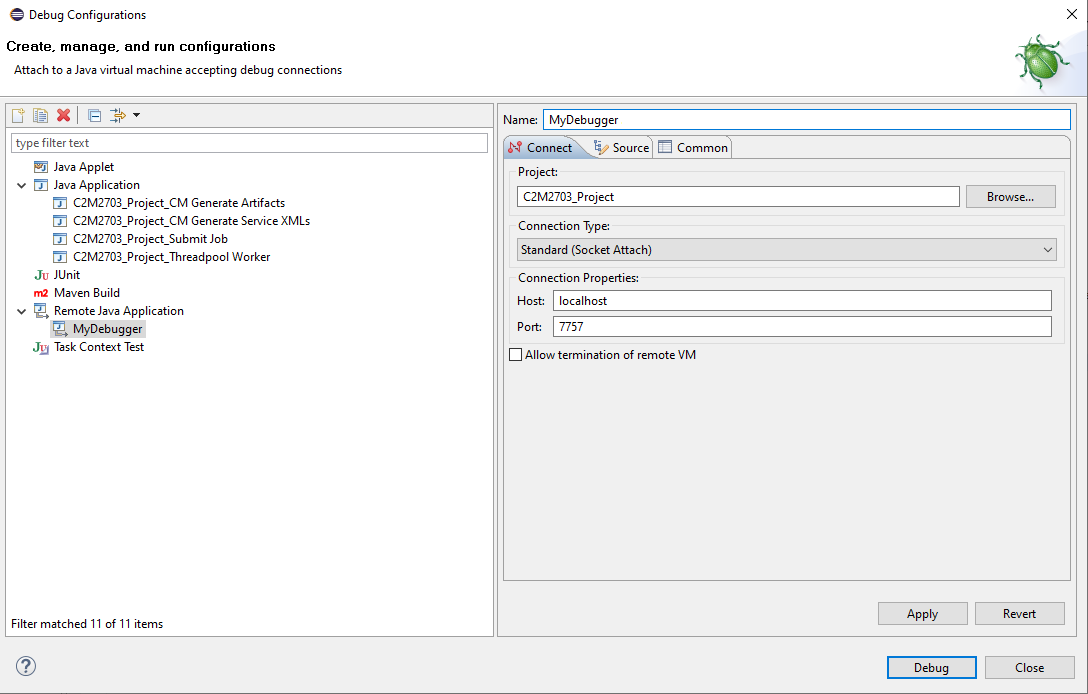
Click on Debug button
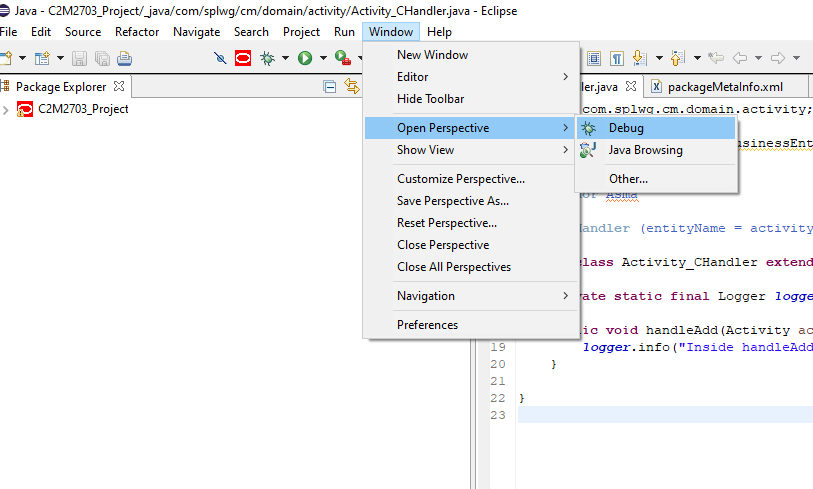
Next Navigate to Window -> Open Perspective -> Debug
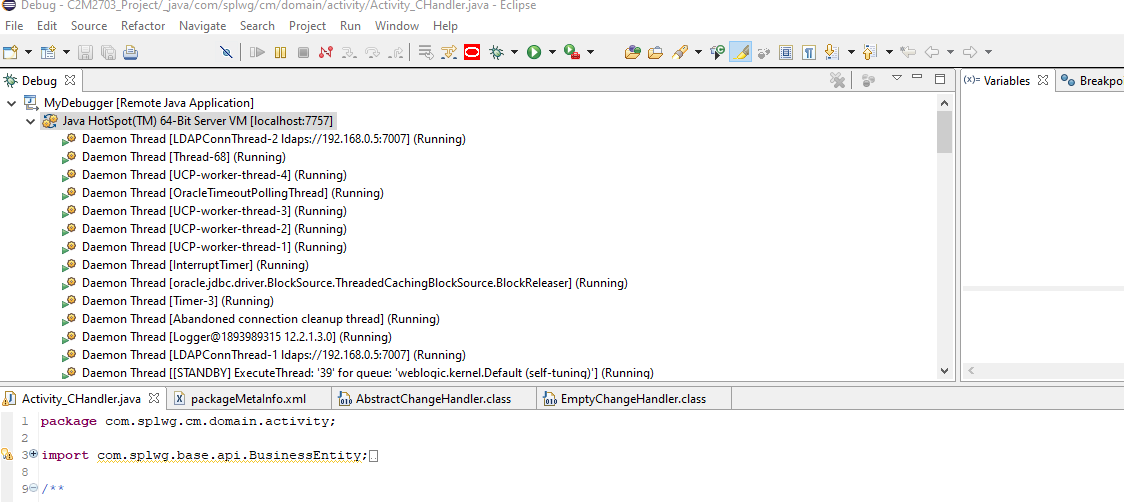
You can see that the debugger has got attached to your server instance. If debugger is not getting attached, restart the eclipse application and try the steps for creating Debug configuration for ‘Remote Java application’ on eclipse again.
Adding breakpoint
Double click on the line you want to add breakpoint. Or right click and add toggle breakpoint

In above example code, I added a field activity from C2M front end using a BPA script. Once field activity is added the breakpoint is hit.
Your browser application screen will hang, and you will see your eclipse application getting highlighted


- Step Into – F5
- Step Over – F6
- Step Return – F7
- Resume – F8
This kind of debugging is useful when you want to check your custom code or out of box code of the product for actual flow at runtime. This helps you verify the values populated in the Java objects at runtime.
You don't have to wait for managed server to completely start to start debugging. If you want to verify classes that are called during server initialization, that can also be done using this. The control will come to eclipse as long a debug point has been added on the class that is being loaded by the framework. This helps, if you want to see how the OUAF framework loads initial objects and caches when server is started.


This works great when debugging Java in the online application. What about debugging batch? When I debug batch in Eclipse, I have to get the listening port from the TPW console window because it changes each time TPW runs. Where would I set it to use a specific port each time rather than some random one?
ReplyDeleteIts all about setting the debug port on the java runtime before the server starts. For TPW also you can open the tpw shell script and add the option to set the port in the script so that it adds the debug port to the java option before starting.
DeleteAlso for batches, if you want to debug you can directly invoke the batch from Junit from eclipse and debug it. You don't need to hook to the port.
Delete