As an example, have built a zone to display temperature forecast for a city for 'x' number of days.
It uses a webservice provided by weatherapi to fetch the weather data.
Below is an example of the webservice URL.
As seen below the URL has location the days as parameters.
http://api.weatherapi.com/v1/forecast.xml?key=API-KEY&q=London&days=4&aqi=no&alerts=no
For using this webservice, you need to register at the website. The site provides you an API KEY which you have to provide in the key parameter in the URL above.
This is how a sample response looks like from the webservice. This is not the actual complete response. Have trimmed it to show only necessary information for one day forecast. The forecastday tag is looped for each day.
We will design our zone to fetch the minimum, maximum and average temperatures forecasted for each day from the webservice. The data being fetched in highlighted in the sample below.
<root> <location> <name>London</name> <region>City of London, Greater London</region> <country>United Kingdom</country> <lat>51.52</lat> <lon>-0.11</lon> <tz_id>Europe/London</tz_id> <localtime_epoch>1660328677</localtime_epoch> <localtime>2022-08-12 19:24</localtime> </location> <current> <last_updated_epoch>1660328100</last_updated_epoch> <last_updated>2022-08-12 19:15</last_updated> <temp_c>31</temp_c> <temp_f>87.8</temp_f> <is_day>1</is_day> <condition> <text>Sunny</text> <icon>//cdn.weatherapi.com/weather/64x64/day/113.png</icon> <code>1000</code> </condition> <wind_mph>12.5</wind_mph> <wind_kph>20.2</wind_kph> <wind_degree>110</wind_degree> <wind_dir>ESE</wind_dir> <pressure_mb>1016</pressure_mb> <pressure_in>30</pressure_in> <precip_mm>0</precip_mm> <precip_in>0</precip_in> <humidity>26</humidity> <cloud>0</cloud> <feelslike_c>29.6</feelslike_c> <feelslike_f>85.2</feelslike_f> <vis_km>10</vis_km> <vis_miles>6</vis_miles> <uv>7</uv> <gust_mph>11.2</gust_mph> <gust_kph>18</gust_kph> </current> <forecast> <forecastday> <date>2022-08-12</date> <date_epoch>1660262400</date_epoch> <day> <maxtemp_c>33.6</maxtemp_c> <maxtemp_f>92.5</maxtemp_f> <mintemp_c>19.6</mintemp_c> <mintemp_f>67.3</mintemp_f> <avgtemp_c>26.1</avgtemp_c> <avgtemp_f>79</avgtemp_f> <maxwind_mph>10.7</maxwind_mph> <maxwind_kph>17.3</maxwind_kph> <totalprecip_mm>0</totalprecip_mm> <totalprecip_in>0</totalprecip_in> <avgvis_km>10</avgvis_km> <avgvis_miles>6</avgvis_miles> <avghumidity>40</avghumidity> <daily_will_it_rain>0</daily_will_it_rain> <daily_chance_of_rain>0</daily_chance_of_rain> <daily_will_it_snow>0</daily_will_it_snow> <daily_chance_of_snow>0</daily_chance_of_snow> <condition> <text>Sunny</text> <icon>//cdn.weatherapi.com/weather/64x64/day/113.png</icon> <code>1000</code> </condition> <uv>7</uv> </day> </forecastday> </forecast> </root>
|
Next configure Outbound message BO, Outbound message Type, Message Sender and external system for enabling integration to the webservice.
Outbound message BO
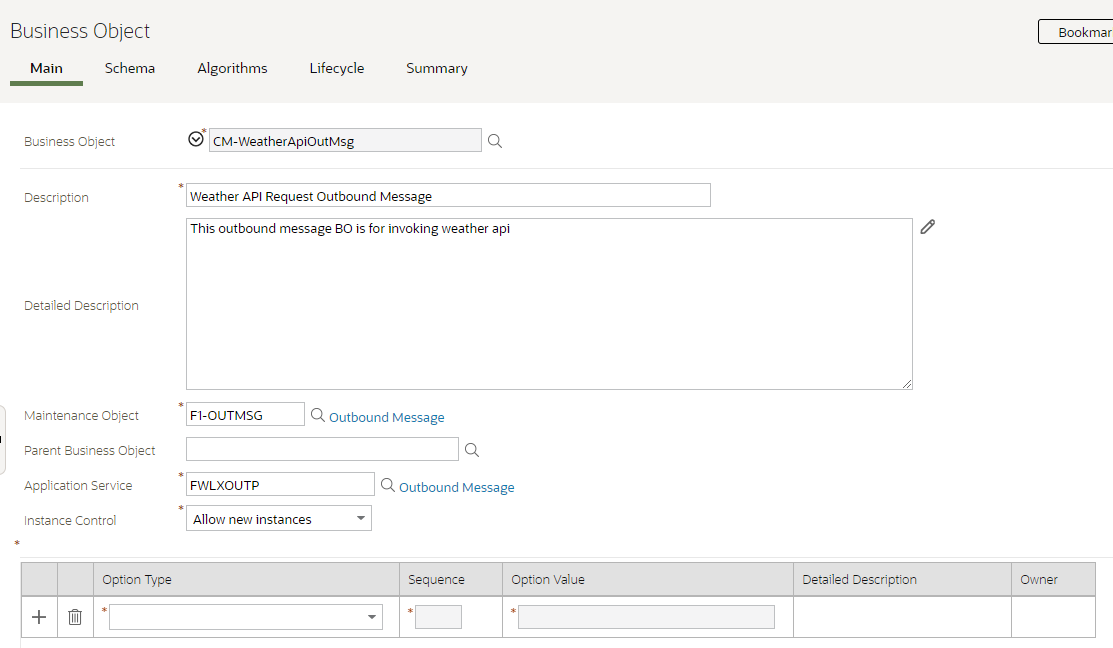
Schema of Business Object. As highlighted below I have named the response tag as ‘root’ to correspond to the first tag on the webservice response. Also ensure you add the data area ‘F1-OM-DynamicConfig’ to the BO schema. This enables you to modify the URL of the webservice and attach parameters to the webservice before calling it, without changing the message sender configuration.
We would be using this to pass the ‘location’ and ‘No of days’ parameters to the webservice later.
<schema> <includeDA name="F1-OM-DynamicConfig"/> <outboundMessageId mapField="OUTMSG_ID" dataType="string"/> <externalSystem fkRef="F1-ESTMP" mapField="NT_XID_CD" dataType="string"/> <outboundMessageType fkRef="F1-OMTYP" mapField="OUTMSG_TYPE_CD" dataType="string"/> <processingMethod dataType="lookup" mapField="OUTMSG_PROC_METH_FLG" lookup="OUTMSG_PROC_METH_FLG"/> <outboundMessageStatus dataType="lookup" mapField="OUTMSG_STATUS_FLG" lookup="OUTMSG_STATUS_FLG"/> <creationDateTime dataType="dateTime" mapField="CRE_DTTM"/> <sendDetails type="group" mapXML="XML_SOURCE"/> <root type="raw" mapXML="XML_RESPONSE"/> </schema> |
Message Sender Configuration:
Message sender is configured for Real Time HTTP messages message class.

Set HTTP method to POST
Set URL to the weather api URL, excluding the parameters
HTTP URL 1 | http://api.weatherapi.com/v1/forecast.xml? |

Outbound Message Type Configuration:
Configure Outbound Message Type using earlier creating Outbound Message BO


External System:
Configure an external system for Weather API server. Link the Outbound message type and Message sender created earlier on it.

Next create a service script. This is the script which would be attached on ‘Preprocessing Service script’ parameter of the zone.

Design the schema of the service script to accept to filter values from the zone. As seen below we are accepting location and No of Days as input parameters.

Populate Data Area as shown below.

Script steps are as shown below. The first step calls the webservice and retrieves the response. The next step inserts the response data in the global temporary table.

Below are the script step details for your reference.
Step 10:
As seen below we are using ‘dynamicConfiguration/queryParms’ to add query parameters to the URL configured on Message Sender before the service is called.
http://api.weatherapi.com/v1/forecast.xml?key=API-KEY&q=London&days=4&aqi=no&alerts=no
The API-KEY needs to be replaced with the key you received from Weather API website after registering.
Next the script is using F1-OutmsgMediator to create the outbound message. Note that the ‘persist’ field on the service is set to ‘false’. This is needed, else the service throws an exception if the script tries to save any data to the database. Since zone is only for querying of data, it doesn’t allow to store anything permanently on database, during execution of the zone.
Step 20:
In this step we are looping through the webservice response and storing the data in global temporary table. As seen we are storing the minimum, maximum and average temperatures respectively for each date in the forecast range.
Step 10 – Call Weather API webservice |

|
// setting outbound message parameters move 'CM-WTHAPI' to "CM-WeatherApiOutMsg/externalSystem"; move 'CM-WEATHAPI' to "CM-WeatherApiOutMsg/outboundMessageType"; move 'F1RT' to "CM-WeatherApiOutMsg/processingMethod";
// defaulting location parameter to London if it is blank if("parm/location = $BLANK") move 'London' to "parm/location"; end-if;
// defaulting No of Days parameter to 5 if it is blank if("parm/noOfDays = $BLANK") move '5' to "parm/noOfDays"; end-if;
// creating parameter URL if("parm/location != $BLANK") move 'key=API-KEY' to $token1; move '&days=' to $token2; move '&aqi=no&alerts=no' to $token3; move "concat($token1, parm/location, $token2, parm/noOfDays, $token3)" to "CM-WeatherApiOutMsg/dynamicConfiguration/queryParms"; end-if;
// Creating the outbound message using Mediator and calling the webservice move 'false' to "F1-OutmsgMediator/persist"; move 'true' to "F1-OutmsgMediator/trapError"; move 'CM-WeatherApiOutMsg' to "F1-OutmsgMediator/businessObjectName"; move "CM-WeatherApiOutMsg" to "F1-OutmsgMediator/businessObjectRequest"; invokeBS 'F1-OutmsgMediator' using "F1-OutmsgMediator";
// Verifying if the webservice invocation was successful if ("string(F1-OutmsgMediator/hadError) = 'true'") terminate with error (11114, 31024); end-if;
// Moving the Webservice response back to Data area move "F1-OutmsgMediator/businessObjectRequest" to "CM-WeatherApiOutMsg"; |
|
Step 20 - Insert data from webservice repsonse in the global temporary table. |

|
// Fetching Minimum, Maximum and Average Temperature for Each forecast day for ($row in "CM-WeatherApiOutMsg/root/forecast/forecastday") move "$row/date" to "F1-InsertGTTRecords/+row/colVarchar1"; move "$row/day/maxtemp_c" to "F1-InsertGTTRecords/row[last()]/colVarchar2"; move "$row/day/mintemp_c" to "F1-InsertGTTRecords/row[last()]/colVarchar3"; move "$row/day/avgtemp_c" to "F1-InsertGTTRecords/row[last()]/colVarchar4"; end-for;
// Inserting records into temporary table if ("count(F1-InsertGTTRecords/row) > 0") invokeBS 'F1-InsertGTTRecords' using "F1-InsertGTTRecords"; end-if; |
Zone Configuration:
Next create an Info Data Explorer zone
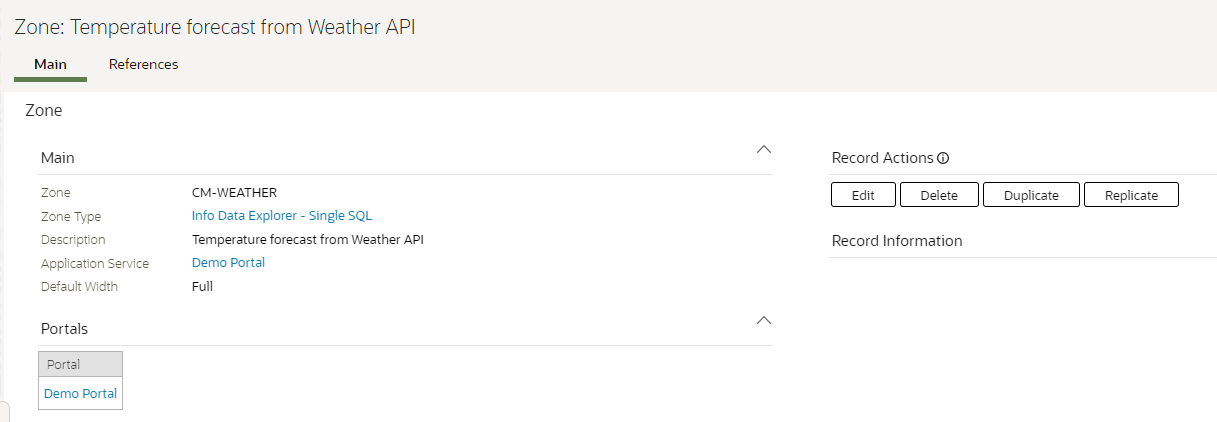
Add the zone to a portal so it can be opened and displayed.

Zone Filter Configuration:
As seen below two user filters for ‘location’ and ‘No. of Days’ are added.

Zone SQL configuration:
As seen below sql to query the global temporary table is written. Four columns are configured for displaying.

As seen below, first column is the forecast date, next is the Max temperature, next is Min Temperature and next is Avg Temperature.
SQL Statement |
select F1_GTT_COL1_VCHAR, F1_GTT_COL2_VCHAR, F1_GTT_COL3_VCHAR, F1_GTT_COL4_VCHAR from F1_GENERIC_GTT |
Parameter Name | Parameter Value |
Column 1 | source=SQLCOL sqlcol=1 label='Date' |
Column 2 | source=SQLCOL sqlcol=2 label=' Max Temperature' |
Column 3 | source=SQLCOL sqlcol=3 label=' Min Temperature' |
Column 4 | source=SQLCOL sqlcol=4 label=' Avg Temperature' |
Zone General Parameters Configuration:
As seen below the service script created earlier is attached on preprocessing service script. Have configured some visualization options also to view the data in chart format. More details for each visualization also covered below.

Parameter Name | Parameter Value |
Pre-Processing Service Script | ss=CM-GetWthDta input=[location=F1 noOfDays=F2] |
Visualization Option 1 | optiontype=CHART oraChart="type:bar; showLegend:true;" oraChartSeries1="xaxis:C1; xaxisFormat:string; label:Temperature; amount:C2; hoverText:$axis$newline$amount;" |
Visualization Option 2 | optiontype=CHART oraChart="type:line; showLegend:true;" oraChartSeries1="xaxis:C1; xaxisFormat:string; label:Temperature; amount:C2; hoverText:$axis$newline$amount;" |
Visualization Option 3 | optiontype=CHART oraChart="type:area; showLegend:true;" oraChartSeries1="xaxis:C1; xaxisFormat:string; label:Temperature; amount:C2; hoverText:$axis$newline$amount;" |
Visualization Option 4 | optiontype=CHART oraChart="type:cluster; showLegend:true;" oraChartSeries1="xaxis:C1; xaxisFormat:string; label:Maximum Temperature; amount:C2;hoverText:$label$newline$amount;" oraChartSeries2="xaxis:C1; xaxisFormat:string; label:Minimum Temperature; amount:C3;hoverText:$label$newline$amount;" oraChartSeries3="xaxis:C1; xaxisFormat:string; label:Average Temperature; amount:C4;hoverText:$label$newline$amount;" |
Visualization Option 5 | optiontype=GRID |
Initial Display Columns | C1 C2 C3 C4 |
Below is the default view of the zone when the user opens the portal. In this case no filter is specified and the service script, defaults the location to ‘London’ and ‘No. of Days’ to 5. As seen below data for 5 days is displayed.

Clicking on filter symbol on top right of zone and enter ‘New York’ in location filter and ‘7’ in no. of days filter.
As seen below, the zone calls the service script with the filter fields as input, immediately after the search button is clicked. The service script calls the webservice and passes the location and no. of days fields in request and receives the weather forecast response back from webservice. The service script, then stores the temperature forecast data in the temporary table. The control comes back to the zone after that. The zone runs the sql query on the temporary table and displays the data on the zone.
Below is a process diagram to understand the execution process.

As seen below the data is displayed on the zone.

Visualization 1:
This shows the zone information is Bar format.
Parameter Name | Parameter Value |
Visualization Option 1 | optiontype=CHART oraChart="type:bar; showLegend:true;" oraChartSeries1="xaxis:C1; xaxisFormat:string; label:Temperature; amount:C2; hoverText:$axis$newline$amount;" |

Visualization 2:
This shows the zone information is Line format.
Parameter Name | Parameter Value |
Visualization Option 2 | optiontype=CHART oraChart="type:line; showLegend:true;" oraChartSeries1="xaxis:C1; xaxisFormat:string; label:Temperature; amount:C2; hoverText:$axis$newline$amount;" |

Visualization 3:
This shows the zone information is Area format.
Parameter Name | Parameter Value |
Visualization Option 3 | optiontype=CHART oraChart="type:area; showLegend:true;" oraChartSeries1="xaxis:C1; xaxisFormat:string; label:Temperature; amount:C2; hoverText:$axis$newline$amount;" |

Visualization 4:
This shows the zone information is Cluster format.
This displays all three column data Min, Max and Avg Temperature together.
Parameter Name | Parameter Value |
Visualization Option 4 | optiontype=CHART oraChart="type:cluster; showLegend:true;" oraChartSeries1="xaxis:C1; xaxisFormat:string; label:Maximum Temperature; amount:C2;hoverText:$label$newline$amount;" oraChartSeries2="xaxis:C1; xaxisFormat:string; label:Minimum Temperature; amount:C3;hoverText:$label$newline$amount;" oraChartSeries3="xaxis:C1; xaxisFormat:string; label:Average Temperature; amount:C4;hoverText:$label$newline$amount;" |
As seen below using above configuration, you can easily display the fetched information in a visually informative way.

Thus we have covered how to design a zone to fetch data real time from a webservice and display the data in a visually appealing form on the zone. It needs some coding for the service script and needs integration configuration. The zone configuration is relatively straightforward.
This simple way of using data from an external system and combining it with data present in CC&B system can be used in multiple ways to analyse and display data in multitude of ways. Hopefully it helps in solving any business requirements to display information dependent on real time external data.


Very nice :) Keep these amazing samples coming.
ReplyDelete:-)
Deletenice :) can you do an example for using JSON adapter ?
ReplyDeleteSure. Sometime soon :-)
Deletevery nice, something new I learnt :) thanks!
ReplyDeleteJust wanted to say thanks for documenting all these things.. been incredibly helpful!
ReplyDelete:-)
DeleteThank you Sreeneeth
ReplyDelete